Operating footprint, local authority exposure, regional concentration, and market context.
Provider Intelligence
Strategic market intelligence for registered providers
A board-ready report outlining where you operate, how concentrated your footprint is, how your structure compares with peers, and how your local markets are changing over time.
Market Snapshot
See local provider markets at a glance
The report uses local authority-level provider data to show stock scale, provider presence, concentration, movement and market mix.
Loading map...
What the report covers
A structured view of footprint, peers, structure and movement
The report combines market context, peer benchmarking, portfolio structure, and local movement analysis into a concise pack designed for strategic review.
How structurally typical your footprint is against comparable providers.
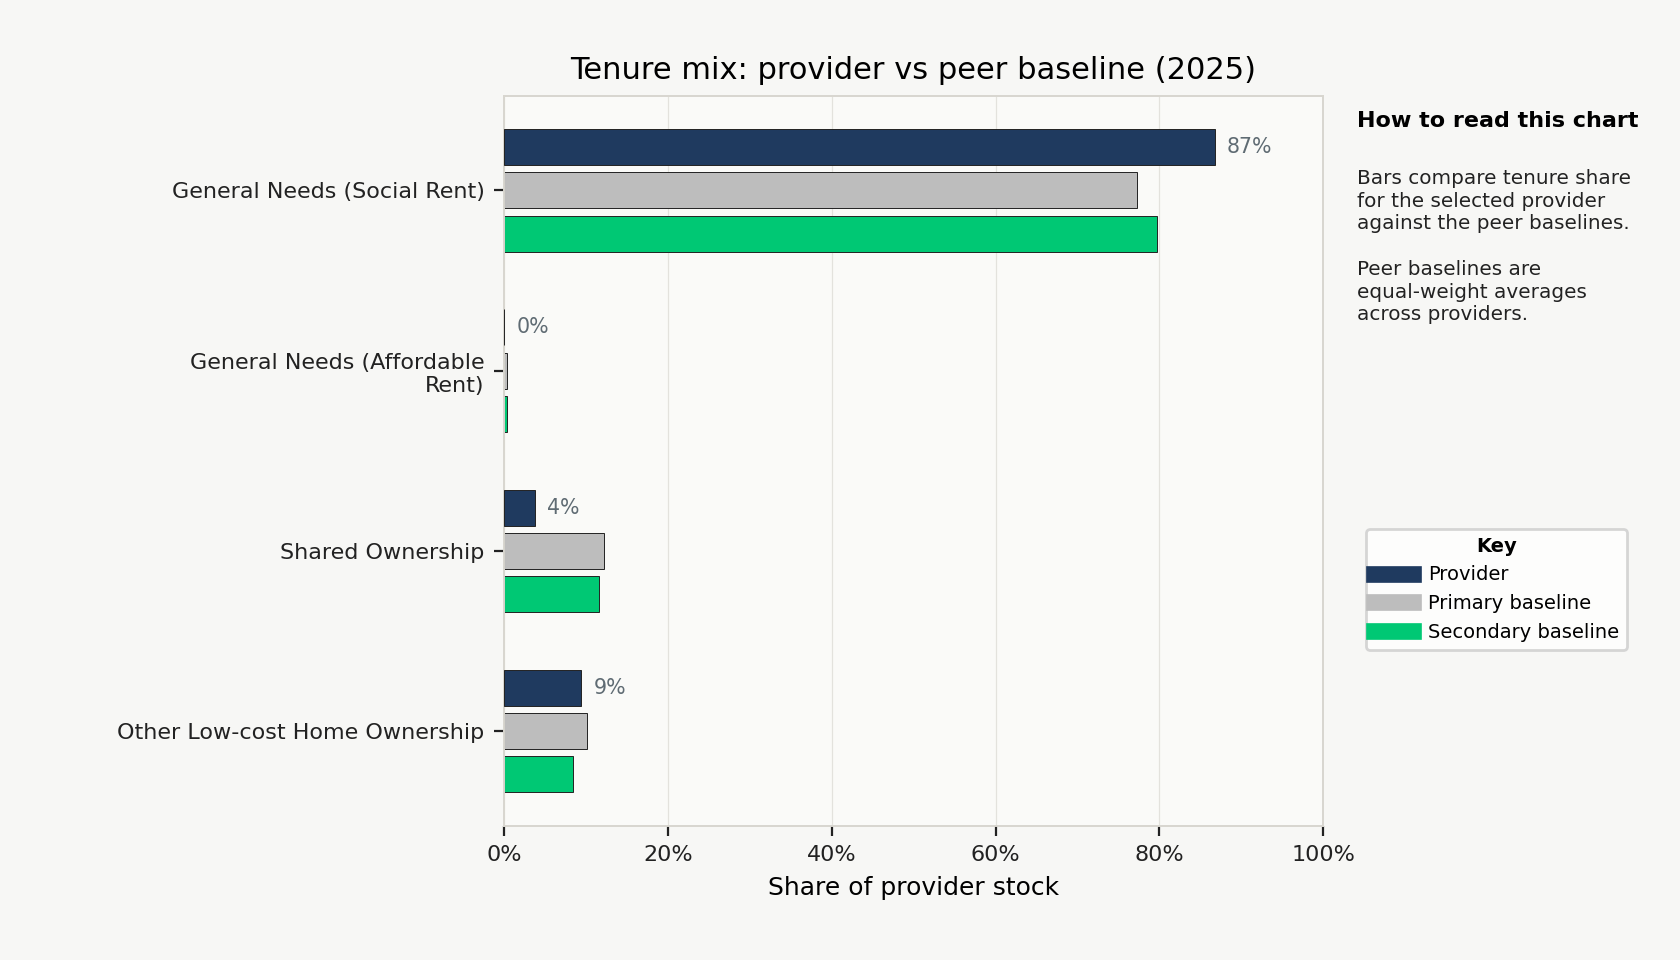
Tenure mix, core vs tail exposure, and where structural sensitivities sit.
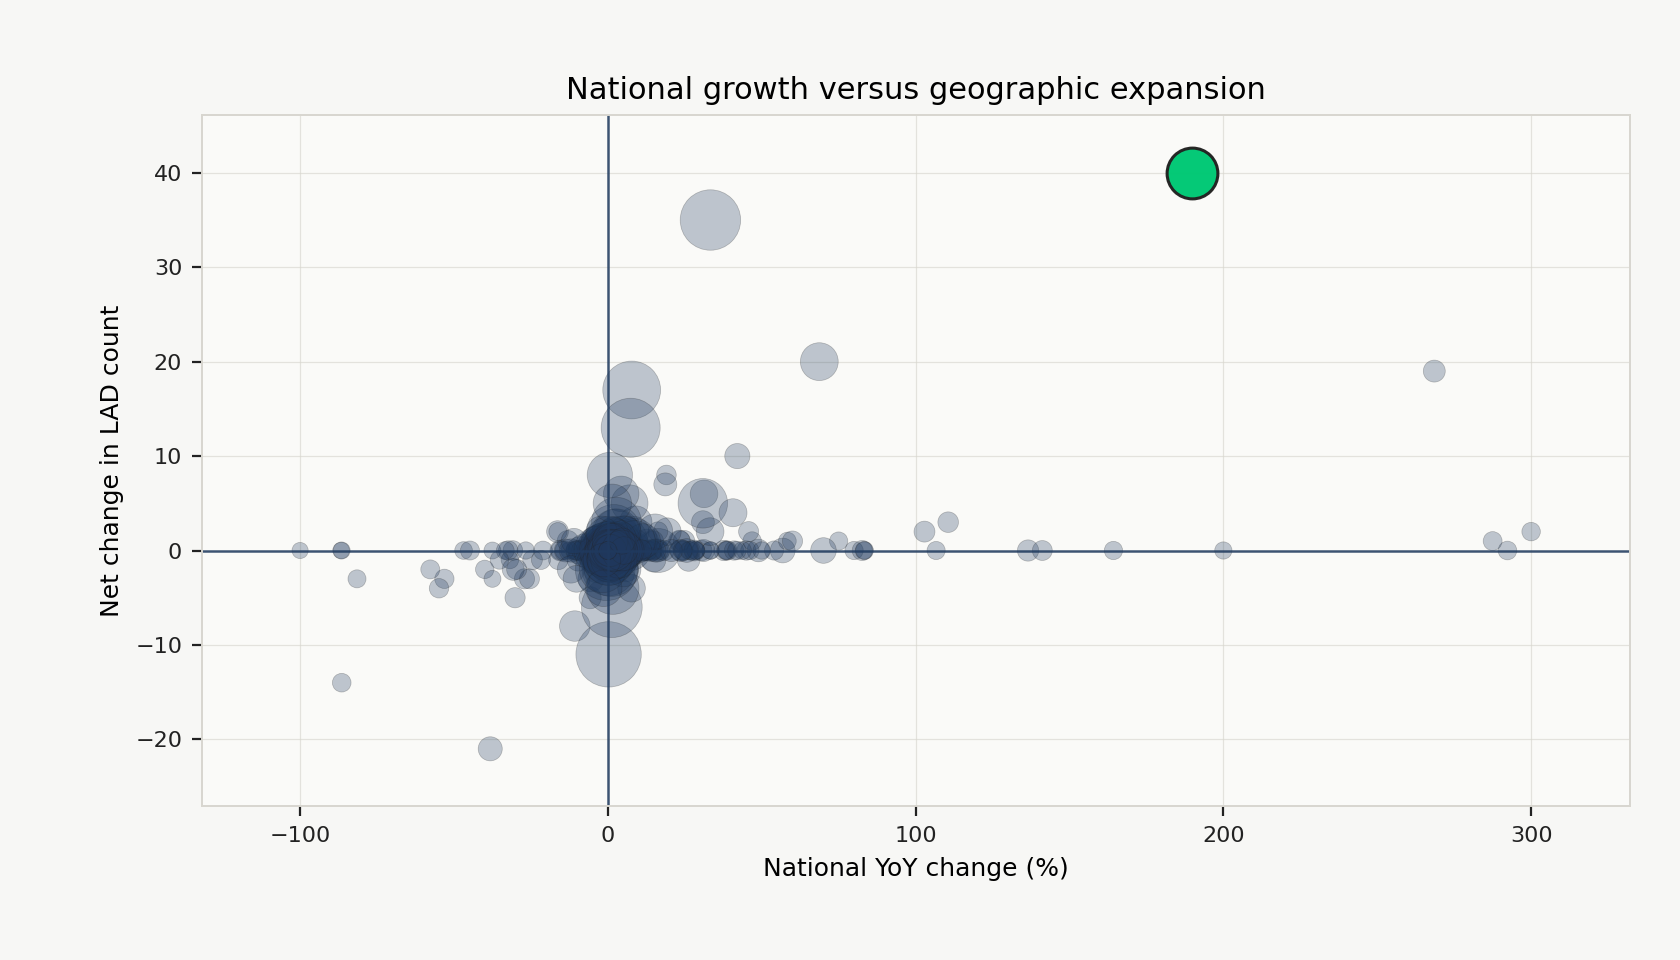
National, regional, and local stock movement, including entries and withdrawals.
Detailed analysis of priority LADs, including provider rank, share, and local market dynamics.
What is Included
A structured diagnostic of provider position and movement
The report combines footprint analysis, peer benchmarking, portfolio structure, and local market movement into a concise board-ready pack.
Provider Market Position
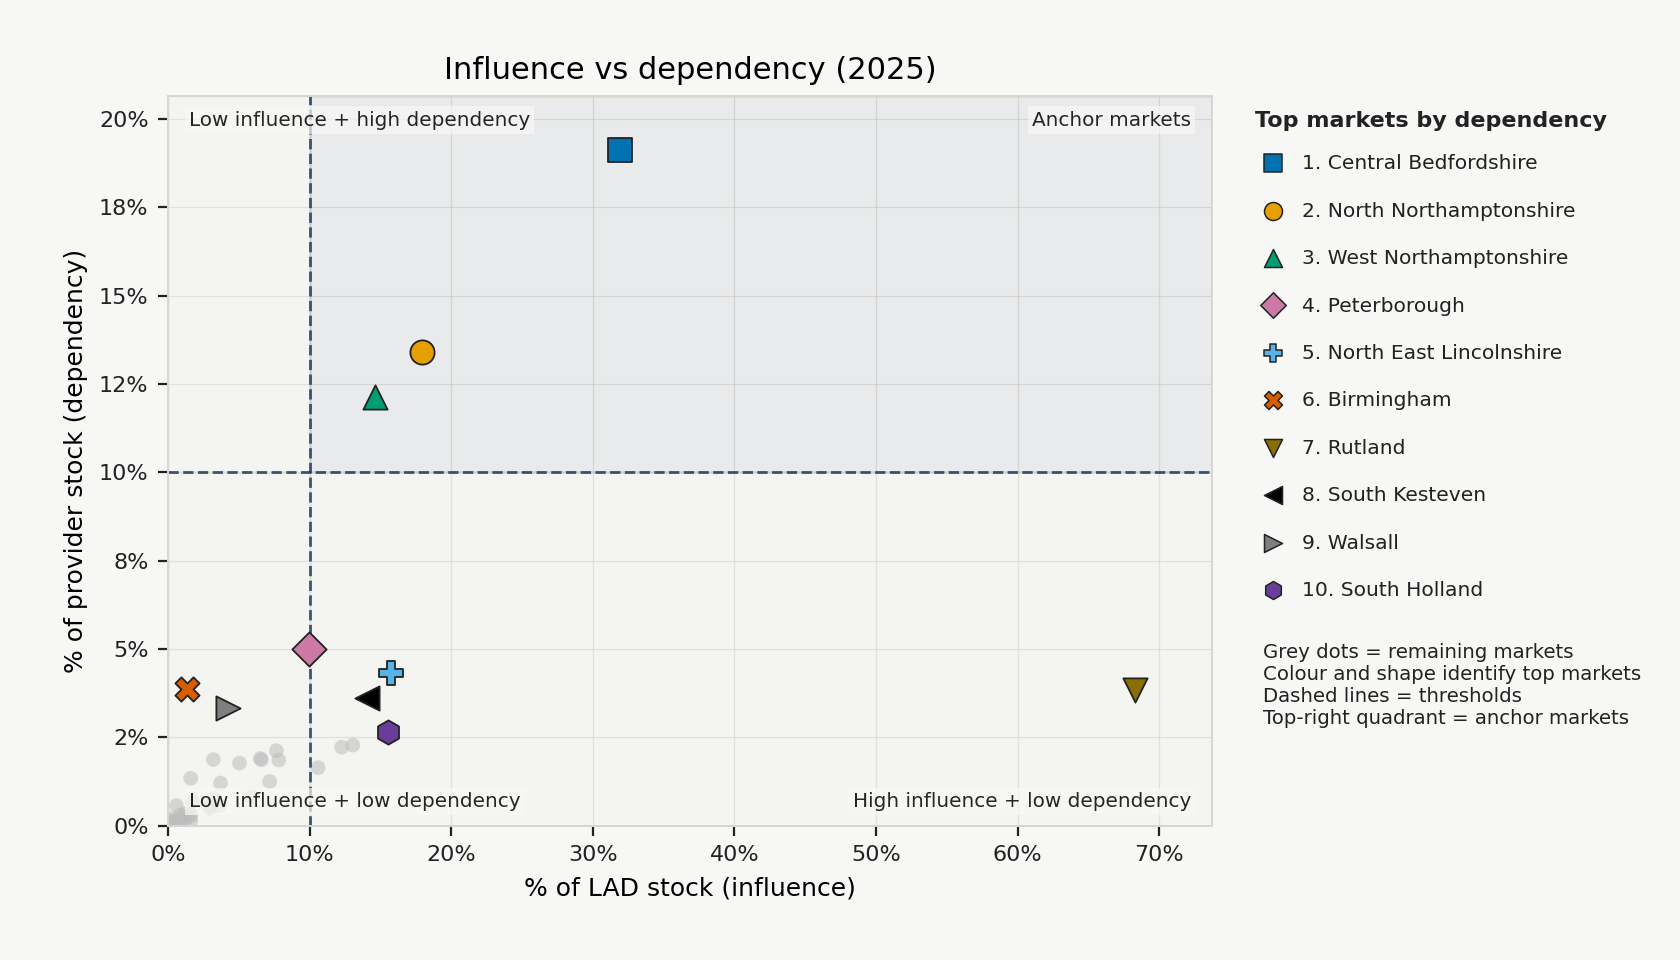
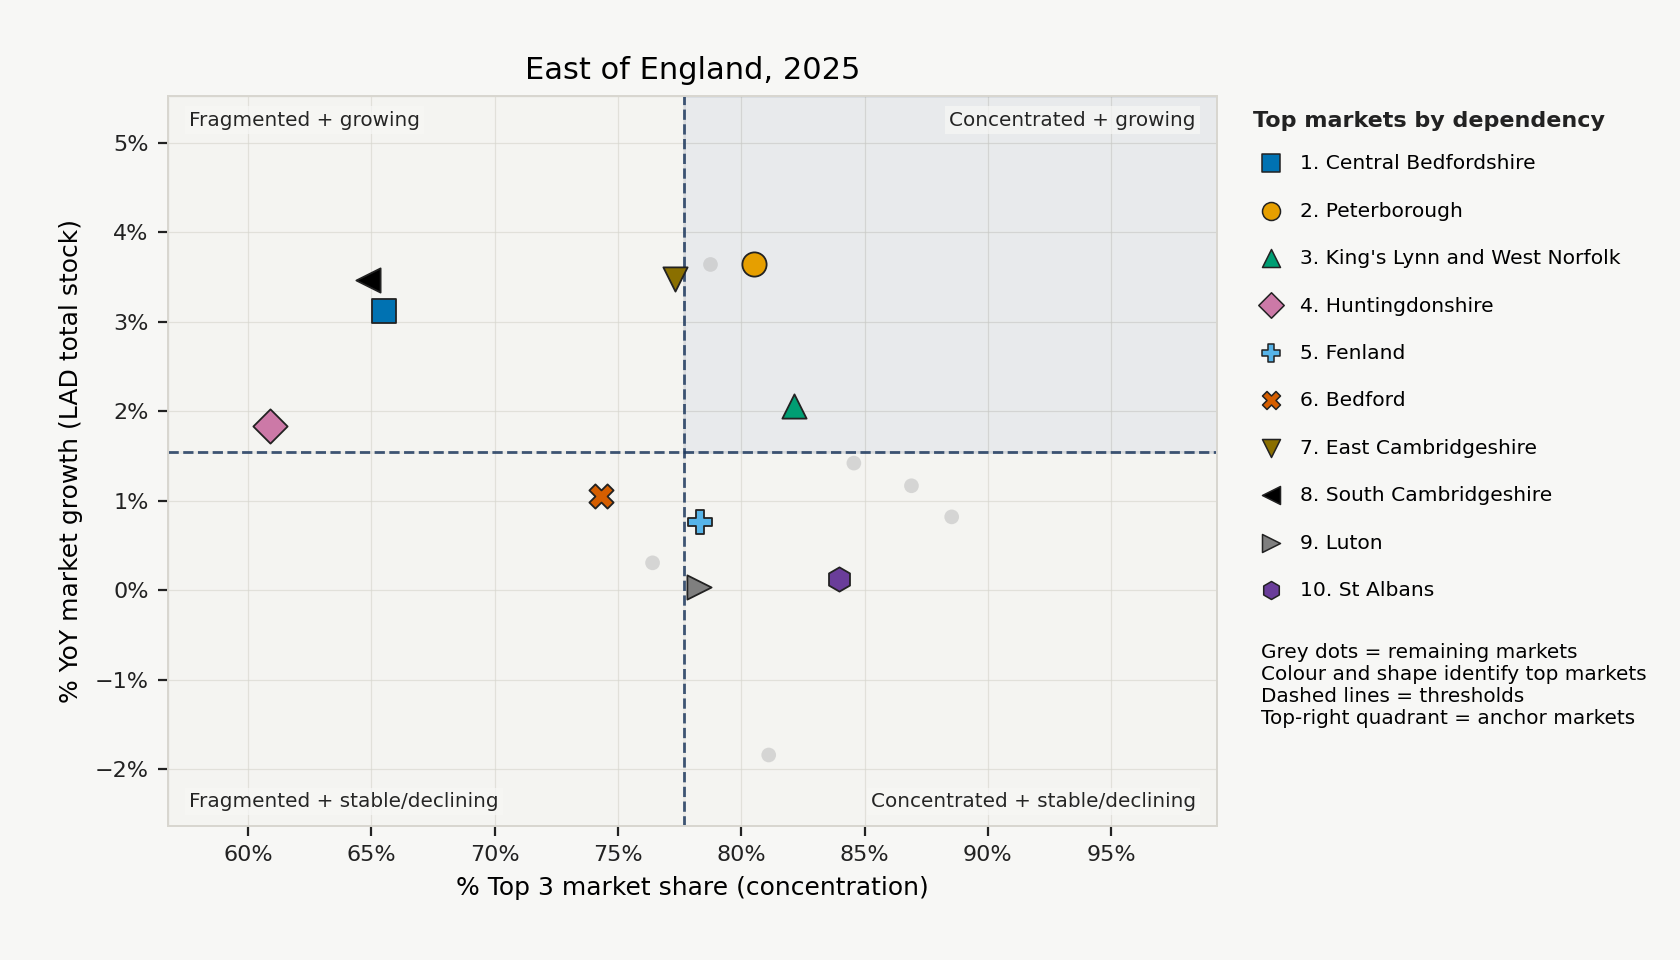
A structured view of your market footprint across every Local Authority you operate in. The report quantifies market share, concentration, and exposure to identify core markets, dominant positions, dependency risks, and the balance between core and tail geographies.
Peer and Movement Analysis
The report benchmarks your footprint against comparable providers and then tracks recent market movement. This shows whether your operating model is more concentrated or distributed than peers.
Portfolio Composition and Structural Mix
The report assesses whether your portfolio is concentrated by tenure, by place, or through the interaction between the two. This helps identify where operating sensitivity sits across core markets, tail geographies, and tenure lines.
Local Provider Movement Panels
The report drills into selected local authorities to show how provider position is changing within the market itself. These panels combine local position, recent stock movement, largest local providers, and entry or withdrawal signals, helping distinguish stable market presence from churn, expansion, retrenchment, or rebalancing.
Delivered as a concise PDF report with annual refresh available.
Local Market Panels
Deep dives into the local authorities that matter most
Priority LADs are reviewed through a consistent panel structure, showing your local role, the wider provider set, market movement, and entry or withdrawal signals.
Position and market structure
Provider stock, share of LAD stock, local rank, dependency, and local market concentration.
Provider set and market power
Largest providers in the LAD, their local share, national scale, and dependency on the market.
Movement and boundary events
Net change, entries, full withdrawals, partial withdrawals, and tenure movement over time.
The main report focuses on the local authorities of greatest strategic interest. The primary report is accompanied by a supplementary document that extends the same LAD panel approach across the provider’s full footprint.
How It Works
A tailored report, built from cleaned provider and market datasets
The report combines public stock returns, structured geography, peer logic, and provider-specific interpretation into a concise output shaped around your organisation.
Confirm the provider scope
We start by confirming the registered provider's structure, identifying any related entities or registered bodies that should be considered.
Build the provider view
We use cleaned public stock and provider datasets to build a comprehensive view of footprint, concentration, peer position, tenure mix, and recent movement.
Review and interpret
We review the analysis, refine the narrative, and add provider-specific interpretations, producing a report designed for executive, board, and strategy discussions.
Next Steps
Request a walkthrough of the Provider Intelligence report
See how the report explains footprint, concentration, peer position, portfolio structure, and recent market movement using real provider and local authority examples.